DATA:
|
|
|
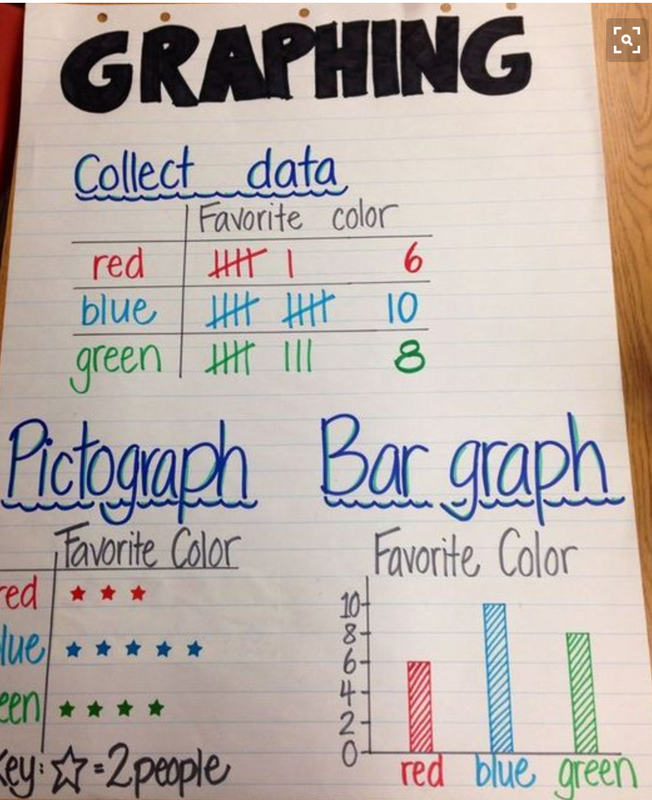
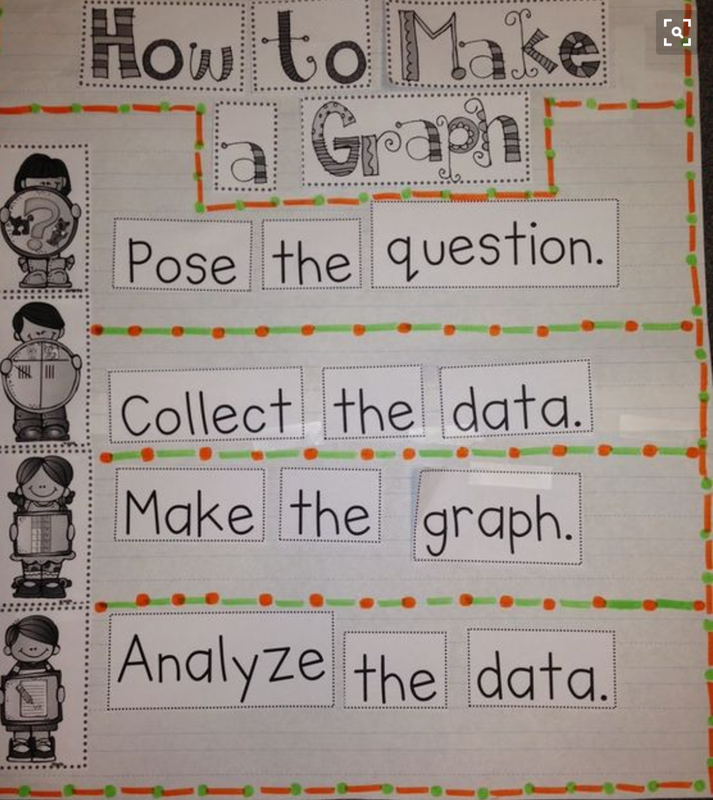
You will collect data from the class, represent it different ways, and come up with questions for your data.
1- Write a question in your journal that has at least four choices. Ask all of your classmates and use tally marks to record their answers. 2- On a piece of construction paper, show your data in a bar graph AND a pictograph. 3- Think of at least two math problems to write about your graphs and add those to the construction paper. Answer your questions on the back. |
